Last Updated on April 29, 2025 by Kristin

Have you ever wondered which states are the most dangerous for driving? No standard methodology defines how “safe” a specific place is to drive in. But government data does provide some clues as to which are the most dangerous states to drive in.
The most current data comes from the National Highway Traffic Safety Administration for 2022. Road hazards, weather, speeding and impaired driving can all play a role in accidents. One statistic that broadly provides some insight into the least safe states for drivers is the number of accident-related deaths per 100,000 people. This number paints a picture as to which states have the highest number of car accident-related deaths in relation to the overall population.
Key Trends in Auto Accidents in the U.S.
It’s important to view accident data against a backdrop of the number of cars on America’s roads. In the decade from 2013 to 2022, there was a 13% increase in registered vehicles in the United States. There was also an 11% increase in licensed drivers, a 7% increase in vehicle miles traveled (VMT), and a 5% increase in the population of the United States. During that decade, there were not only more people in the US, but more drivers, more cars and more miles traveled in cars. In 2022 passenger cars and light trucks accounted for more than three-fourths (76% cumulatively and 33% and 43%, respectively) of the vehicles involved in fatal traffic crashes.
In some states, roads would be safer if laws were followed and enforced.
- Texas had the largest number of speeding-related traffic fatalities in the country. Interestingly, the vast majority of auto fatalities in the U.S. due to speeding (86%) happen on non-interstate roads.
- Three quarters (76%) of people killed in auto accidents in North Dakota in 2022 were not wearing a seat belt (based on known restraint use), the highest percentage in the country, and significantly higher than the 50% national average.
- And in Ohio, the percentage of alcohol-impaired-driving fatalities jumped 10% over that decade to 37%, the largest increase in the country, bringing the Buckeye State 5% above the national average for people killed in alcohol-related crashes.
The 10 States With the Most Traffic Accidents Per Driver
According to the National Highway Traffic Safety Administration, the US saw 42,514 deaths from fatal accidents in 2022, the most recent year with a complete data set. That was a decrease of 1.7% compared with the previous year. Based on that data, here are the states with the highest number of deaths related to traffic accidents.
States with the highest traffic fatality rates per 100,000 licensed drivers
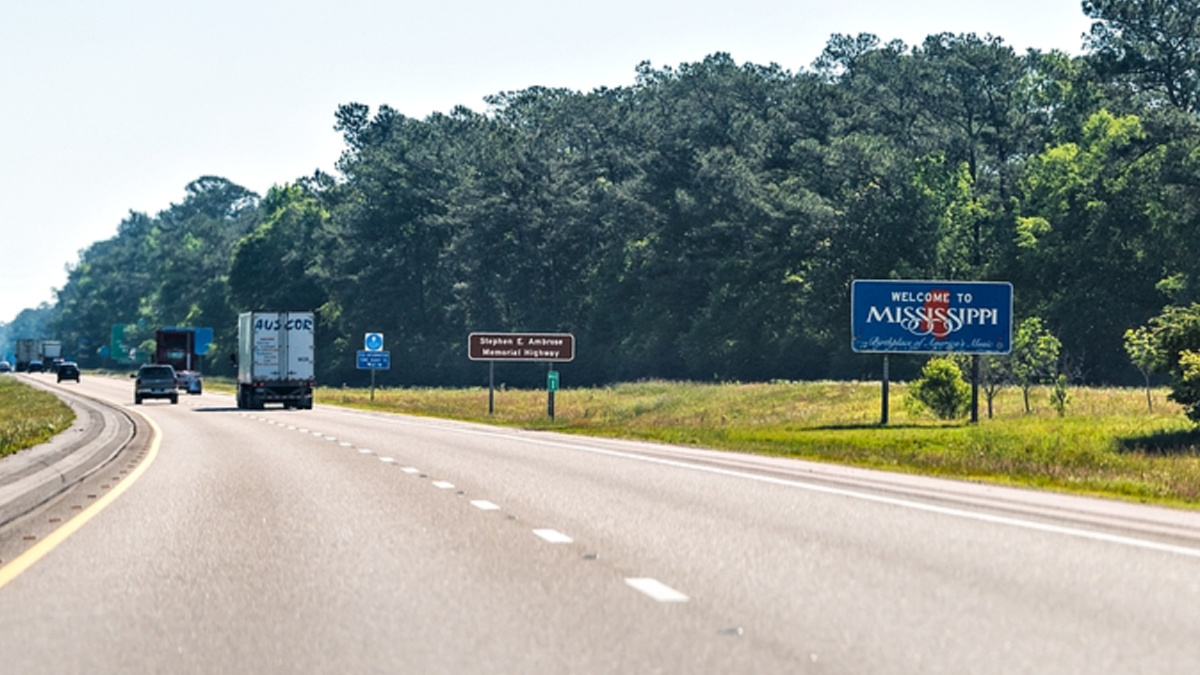
Mississippi (34.34)
New Mexico (30.89)
Arkansas (27.87)
Oklahoma (27.77)
South Carolina (26.74)
Louisiana (26.63)
Tennessee (25.96)
Missouri (24.64)
Montana (24.46)
Georgia (24.41)
Related:


